⚠️ WhyHive has closed down. Read more here.
⚠️ WhyHive has closed down. Read more here.
The simple tool for data analysis
Surveys, sales data, customer feedback, or just about anything in a spreadsheet. Just upload your data to start exploring.

💬 As featured in
Used by data-driven teams
Researchers, marketers, impact evaluators, startups and many more

Plus, like, lots and lots more
+
Plus, like, lots and lots more +
"I think I said 'wow' 4 times the last time I was using WhyHive. I love having the ability to clean data in seconds and create the visual that will show and tell the growth story to team and investors. This will be a go-to tool in our stack for Heatseeker.”
Fiona Triaca
Co-founder & COO @ Heatseeker

“Switching to WhyHive transformed our workflow. I created a full data presentation in just 10 minutes [...] Our Chief of Staff even used it to demo insights to our board.”
Louie Gallina
Marketing Lead @ CreativeCubes

“What the heck?! With zero training, the text analysis picked up all bar two of the themes I had manually (tediously) found. It’s so impressive.”
Georgia Verry
Founder & CEO @ Conscious Combat Club

“My go-to solution for coding open ended survey responses. Not only does it help identify themes from scratch, but it tags according to a traditional code-frame if needed.”
Matt Howley
Managing Partner @ Picnic Customer Research

Buttery smooth charts with just a few clicks
Tell WhyHive what parts of your data you’re interested in and our charting engine does the rest. It’s analysis on easy mode, made for the everyday person.
Find & extract key themes from text
Find key themes then have AI count how often they come up, row by row. Turn burdensome open-ended responses into a rich source of insights.
Analyse text in minutes, not hours
Analyse thousands of rows in minutes. Save hours manually sifting through text responses looking for insights. Works with big and small datasets.
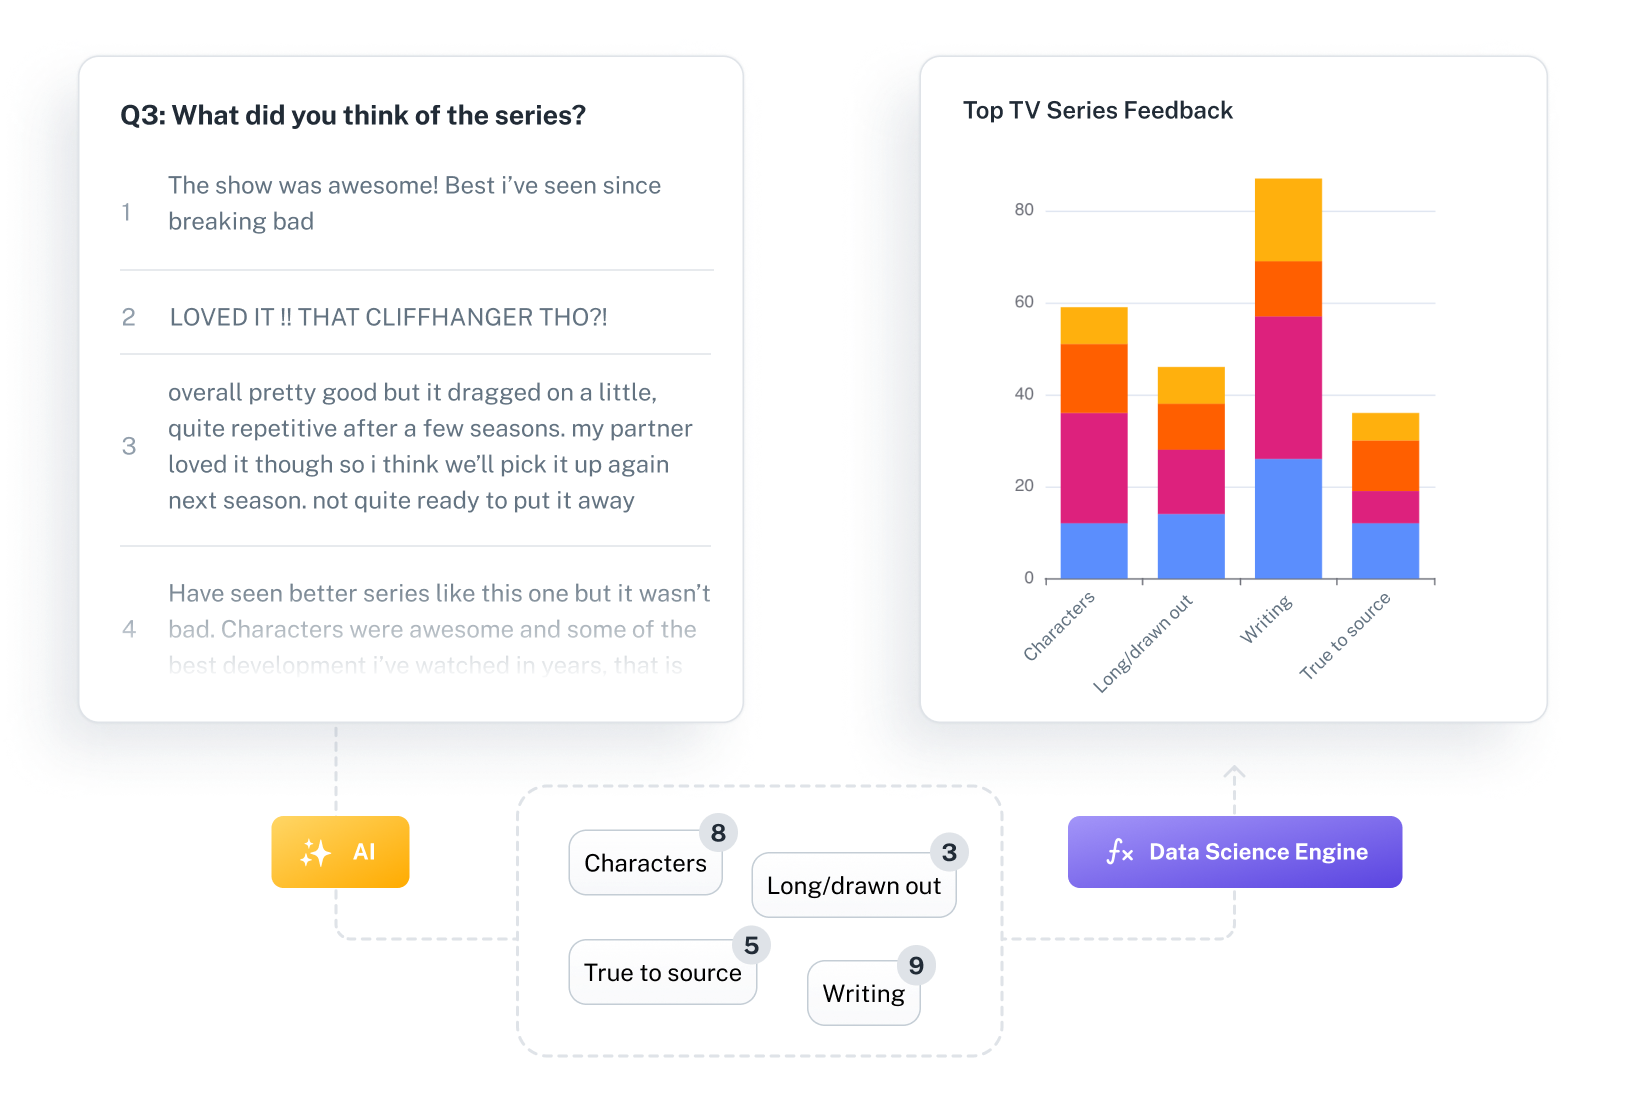
The best of both worlds
We pair AI with a rule-based charting engine to fix some of the big challenges with using AI for data analysis. More reliable, no hallucinations, results you can trust.
Ready to get started?
Secure & Private

Data stored in the US or Aus
Choose whether your data is stored in the United States or Australia.

Not used to train AI models
Data uploaded to WhyHive won’t be used to train third-party AI models like GPT.

Data kept private
We use AES-256 to encrypt data while it’s on our servers.
FAQ
-
No. We use GPT to help with parts of the analysis process, however, none of this data is used to train AI models.
-
Yes. Any data you upload is only viewable to you on your personal WhyHive account. Data cannot be viewed publicly, but a project and its charts can be viewed publicly if you create a shareable link for the project. The WhyHive Team may need to view your data in order to troubleshoot issues.
-
You can choose to have your data stored in Australia or the US. Data is stored on AWS servers. AWS is the same cloud infrastructure used by companies like Canva, Netflix and Meta.
-
No. The charts you see in the WhyHive app are not created by AI and have no risk of being populated by hallucinated (fake) data. We use AI to make part of the exploratory process easier, but the results you see are pulled directly from your data and they aren’t generated by AI*.
*Except when you’re using thematic codes, which are generated by AI. However, you have full control over when this feature is used.
-
Head to our Pricing page. Can’t see a tier that works for you? Get in touch
-
WhyHive works with CSV and Excel file types. It’s great for analysing surveys, sales data, CRMs or impact measurement data.
-
Yes. You can perform text analysis on qualitative data to pull out themes (codes) and assign them, row by row, to your qualitative data. You can then analyse these new themes against your other quantitative data.